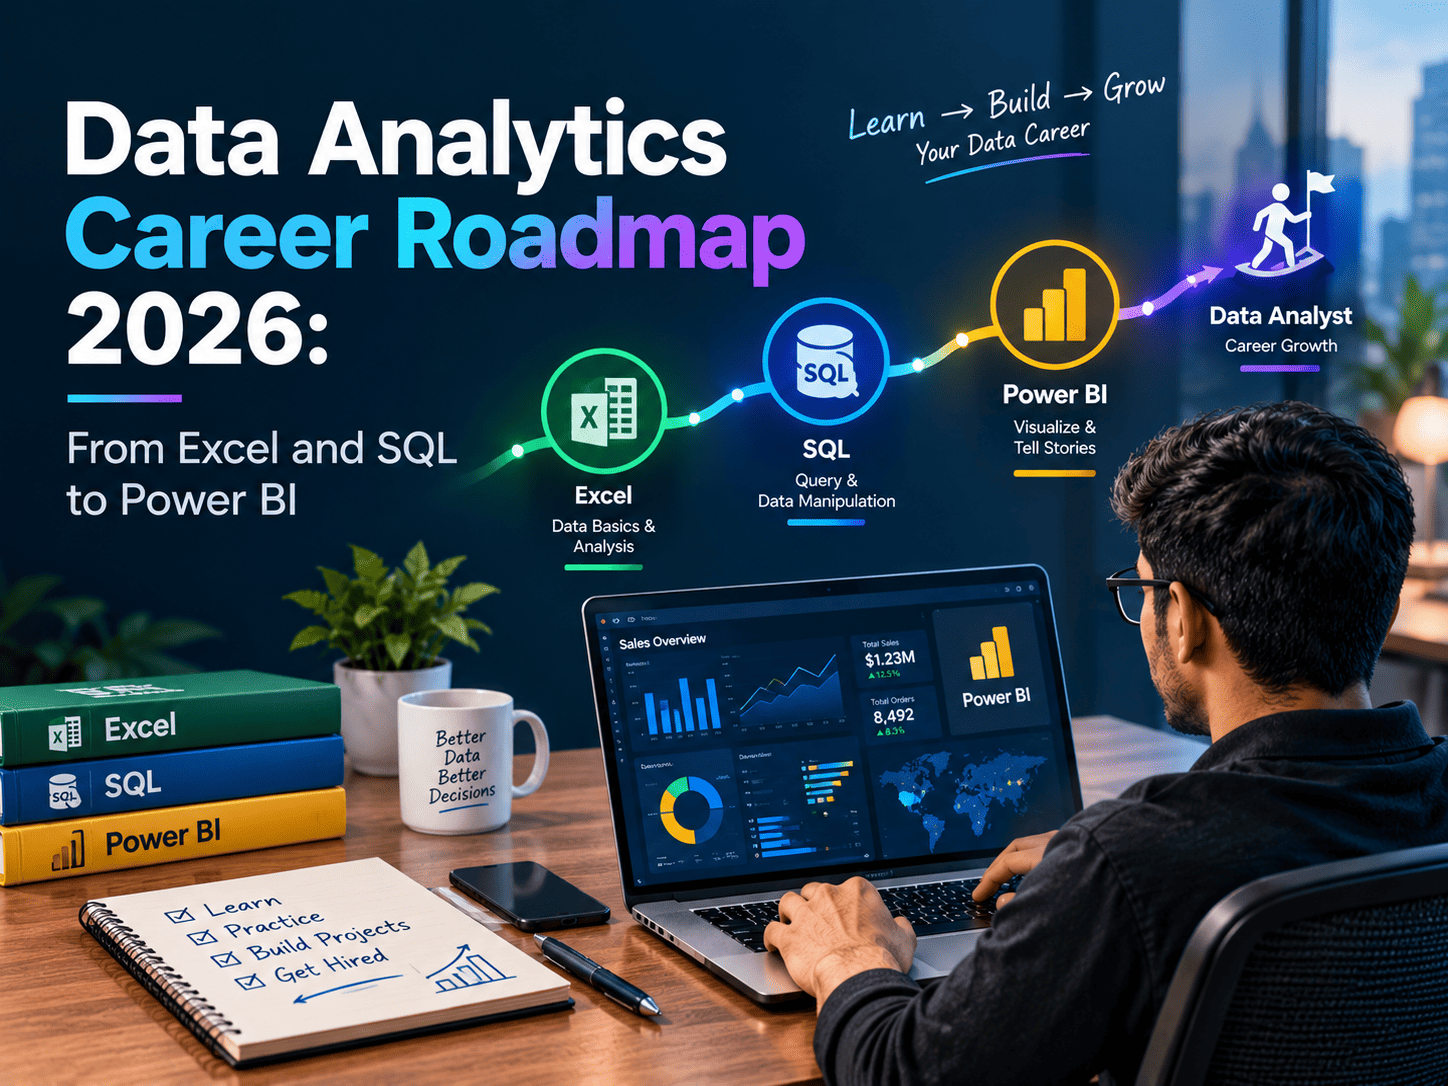
Data Analytics Career Roadmap 2026: From Excel and SQL to Power BI
Data is becoming an important part of modern businesses. Learn how
students can build a Data Analytics career in 2026 by starting with
Excel and SQL and progressing toward Power BI, dashboards and practical projects.
Businesses generate large amounts of data every day through sales,
customers, websites, marketing campaigns, finance and operations.
The ability to understand this data and convert it into useful insights
has become an important part of modern business decision-making.
This is where Data Analytics comes in. Data analysts
work with data to clean it, organize it, analyze patterns and present
meaningful information through reports and dashboards.
For students starting their journey in 2026, Data Analytics does not
require learning every tool at once. A structured roadmap can begin
with Excel, move to SQL, and then
progress toward Power BI, data visualization and
practical projects.
Data Analytics is the process of examining data to identify patterns,
trends, relationships and useful insights that can support business
decisions.
A Data Analyst may work with sales records, customer information,
financial data, website traffic, marketing performance or operational
data depending on the organization and industry.
Collect Data → Gather information from relevant sources
Clean Data → Identify missing, duplicate or incorrect data
Analyze Data → Find patterns, trends and relationships
Visualize Data → Convert information into charts and dashboards
Generate Insights → Support better business decisions
Organizations increasingly depend on data to understand customers,
monitor performance, identify opportunities and measure business
results.
This means students who understand how to work with data can build
useful technical and analytical skills that can be applied across
different industries.
Analyze business performance and support data-driven decisions.
Understand campaigns, customers and marketing performance.
Analyze financial information, trends and business metrics.
Monitor processes, performance and operational efficiency.
Students do not need to learn every analytics technology simultaneously.
A structured skill stack can make the learning process easier.
Excel → SQL → Data Cleaning → Data Analysis → Data Visualization → Power BI → Projects
Excel is a useful starting point for students who are new to Data
Analytics. It provides a practical environment for organizing,
calculating and analyzing structured data.
Beginners should focus on formulas, functions, sorting, filtering,
tables, conditional formatting, charts and PivotTables.
Formulas • Functions • Lookup Functions • PivotTables • Charts •
Data Cleaning • Conditional Formatting • Basic Dashboards
SQL, or Structured Query Language, is widely used to work with data
stored in relational databases.
After becoming comfortable with Excel, students can start learning SQL
to understand how data can be retrieved, filtered, combined and
summarized from databases.
SELECT → Retrieve required data
WHERE → Filter records
GROUP BY → Summarize data
JOIN → Combine information from tables
Aggregate Functions → Calculate metrics such as totals and averages
Real-world datasets are not always perfectly organized. Data may contain
missing values, duplicate records, inconsistent formats or incorrect
entries.
Data cleaning is therefore an important part of analytics. Before
creating a report or dashboard, analysts need to understand the quality
and structure of the dataset.
Identify and appropriately handle missing information.
Detect repeated records that can affect analysis.
Standardize dates, categories and other values.
Check whether the cleaned dataset makes sense.
Tools alone do not make someone a strong Data Analyst. Students also
need analytical thinking and the ability to ask meaningful questions
from a dataset.
Instead of simply creating charts, analysts should understand what the
numbers mean and what business question the analysis is trying to answer.
What happened? → Why did it happen? → What changed? →
What pattern can we identify? → What action could the insight support?
Power BI is a business intelligence and data visualization platform
that can be used to connect data sources, transform data and build
interactive reports and dashboards.
Once students understand Excel, SQL and basic data analysis,
Power BI can help them present their findings in a more interactive
and business-focused format.
1. Import and connect data
2. Clean and transform data
3. Create data models
4. Create calculations and measures
5. Design interactive dashboards
6. Present business insights
Data visualization is about presenting information in a way that makes
patterns and trends easier to understand.
Students should learn when to use different types of charts and how
to avoid unnecessary visual complexity.
Useful for comparing categories.
Useful for showing changes over time.
Useful for highlighting important metrics.
Combine multiple insights into one interactive view.
A structured roadmap can help beginners understand what to learn first
and what to learn next.
Learn formulas, functions, PivotTables, charts and data organization.
Learn queries, filtering, aggregation, joins and database concepts.
Learn how to identify missing, duplicate and inconsistent data.
Develop analytical thinking and learn to identify meaningful patterns.
Build interactive dashboards and communicate business insights visually.
Apply your skills to realistic datasets and create portfolio projects.
Projects can help students apply concepts instead of learning tools only
through theory.
Analyze sales by product, region, month and category using Excel or Power BI.
Explore customer segments, purchase behavior and sales patterns.
Analyze campaign performance and important marketing metrics.
Build a dashboard that presents important business performance indicators.
Learning tools is only one part of becoming a Data Analyst. Students
should also demonstrate how they applied those tools to solve analytical
problems.
A portfolio can include dashboards, SQL analysis, Excel reports and
complete projects with a clear explanation of the problem, data,
analysis and insights.
Excel Project • SQL Project • Power BI Dashboard • Data Cleaning
Example • Business Analysis Project • Project Documentation
AI is becoming increasingly connected with modern data workflows.
However, students should first understand core data concepts before
depending heavily on AI-powered tools.
Strong fundamentals in Excel, SQL, data cleaning, statistics,
visualization and business thinking can help students understand
and validate AI-assisted outputs more effectively.
Excel + SQL + Data Analysis + Visualization + Power BI
→ then explore AI-assisted analytics workflows
Students who develop Data Analytics skills can learn how businesses
use information to measure performance and make decisions.
The learning journey also combines technical skills with logical
thinking, problem-solving and communication.
Students can begin with Excel and gradually move toward SQL,
Power BI, dashboards and practical Data Analytics projects.
Data Analytics skills can be useful across different job functions and
industries. The exact responsibilities depend on the organization and role.
Analyze datasets and generate useful business insights.
Work with business intelligence reports and dashboards.
Prepare reports and monitor important business metrics.
Focus on communicating information through effective visualizations.
Practice formulas, PivotTables, charts and basic data cleaning.
Work with sample databases and solve analytical questions using SQL.
Convert cleaned datasets into interactive reports.
Document your analysis and showcase dashboards and insights.
Data Analytics continues to evolve as organizations adopt cloud
platforms, business intelligence tools, automation and AI-assisted
workflows.
At the same time, fundamental skills such as understanding data,
writing queries, validating results and communicating insights remain
important parts of analytical work.
Data Fundamentals + SQL + Visualization + Power BI +
Analytical Thinking + Practical Projects
Data Analytics is not only about learning software. Students need to
understand how data is structured, how it can be analyzed and how
insights can be communicated effectively.
Learning Excel, SQL, data visualization and Power BI can provide a
structured foundation for students who want to explore Data Analytics.
At TCIIT, students can build practical IT and Data Analytics skills
through technology-focused learning and hands-on projects.
Data Analytics offers a structured learning path for students who want
to develop technical and analytical skills. Instead of trying to learn
every tool at once, beginners can progress from Excel to SQL and then
toward Power BI and practical projects.
The most important part of the journey is not simply collecting tool
names. Students should learn how to clean data, analyze information,
identify patterns and communicate meaningful insights.
For students in 2026, building a foundation in
Excel, SQL, Data Analytics and Power BI can be a
practical way to start exploring the world of data-driven technology.
1. Introduction
2. What Is Data Analytics?
Simple Data Analytics Process
3. Why Learn Data Analytics in 2026?
Business
Marketing
Finance
Operations
4. The Data Analytics Skill Stack
From Basics to Business Intelligence
5. Step 1: Learn Microsoft Excel
6. Step 2: Learn SQL
Important SQL Concepts
7. Step 3: Understand Data Cleaning
Missing Data
Duplicates
Formatting
Validation
8. Step 4: Develop Data Analysis Skills
9. Step 5: Learn Power BI
Power BI Learning Path
10. Step 6: Learn Data Visualization
Bar Charts
Line Charts
Cards
Dashboards
11. Data Analytics Career Roadmap 2026
12. Practical Data Analytics Projects for Students
13. Build a Data Analytics Portfolio
14. Where Does AI Fit Into Data Analytics?
Fundamentals First
15. Important Skills for a Data Analyst
16. Why Should Students Learn Data Analytics?
17. Career Paths After Learning Data Analytics
Data Analyst
BI Analyst
Reporting Analyst
Data Visualization Specialist
18. Common Mistakes Beginners Should Avoid
19. A Practical Learning Plan for Beginners
20. The Future of Data Analytics
The Future Skill Combination
Build Practical Data Analytics Skills
21. Frequently Asked Questions
22. Conclusion