Data Analytics using Excel Course
Our Data Analytics Using Excel Course is designed to help you master the most widely used tool for business data analysis. You’ll learn essential Excel skills including formulas, functions, data cleaning, pivot tables, charts, dashboards, and basic automation with Power Query. The course focuses on real-world business analysis—helping you interpret data, identify trends, and build interactive reports. Through hands-on exercises and practical case studies, you’ll gain the confidence to perform end-to-end data analytics using Excel and create insights that support smart business decisions.
Data Analytics Using Excel Certification Training Course
Our Data Analytics Using Excel Course is designed to teach learners how to leverage Microsoft Excel for data collection, cleaning, analysis, and visualization. This course focuses on practical, hands-on learning to help you gain expertise in using Excel as a powerful tool for data-driven decision-making and business analytics. Whether you are a student, working professional, accountant, HR executive, or aspiring data analyst, this course provides all the skills needed to analyze business data, create reports, and present actionable insights effectively using Excel.
- Introduction to Excel interface and productivity shortcuts
- Data entry, formatting, and data validation
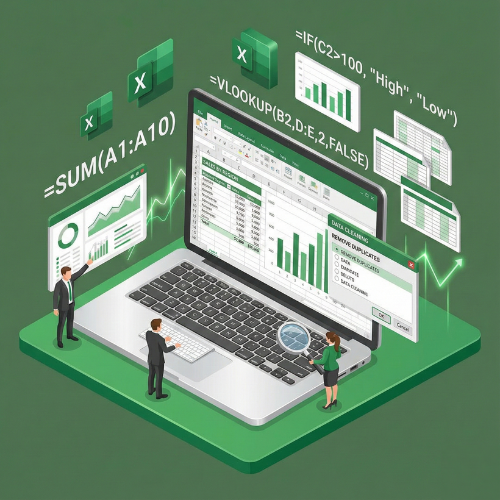
- Advanced formulas & functions: IF, AND, OR, nested formulas
- Lookup functions: VLOOKUP, HLOOKUP, XLOOKUP, INDEX-MATCH
- Text, date, and logical functions
- Conditional formatting and data visualization
Excel is one of the most widely used tools for analytics, reporting, and business intelligence. This course covers advanced Excel functions, formulas, pivot tables, charts, data validation, conditional formatting, macros, and dashboards. You will learn to manage large datasets, perform calculations, automate repetitive tasks, and visualize data to make meaningful business decisions. By the end of this course, learners will be able to handle real-world business data efficiently, perform statistical analysis, create interactive dashboards, and generate professional reports Enroll now and become an Excel Data Analytics expert, capable of delivering insights and creating professional business reports!
What will I learn?
- Ability to analyze and interpret business data using Excel
- Hands-on experience with advanced formulas, PivotTables, and charts
- Skills to automate tasks and build interactive dashboards
- Knowledge of data cleaning, transformation, and reporting techniques
- Practical expertise for roles like Data Analyst, Business Analyst, and Excel Specialist
Requirements
- Basic understanding of computers & Microsoft Excel
- Laptop/PC capable of running Microsoft Excel
- No prior programming or analytics experience required
- Willingness to practice with real datasets and business scenarios
Start Your Enrollment
We are variations of passages the have suffered.
Why Choose Us ?
Our Data Analytics Using Excel Course is designed for beginners and professionals who want to master data analysis with the world’s most widely used tool — Microsoft Excel. At TCIIT, we focus on practical, job-oriented training that helps you understand data, analyze trends, and create meaningful insights with ease. You will learn everything from Excel basics to advanced functions, including Pivot Tables, Power Query, Data Cleaning, Dashboards, and Business Reporting techniques. Each chapter is taught through real datasets and industry-specific assignments, ensuring you gain hands-on experience from day one. Our expert trainers make learning simple, clear, and effective, helping you build confidence in data-driven decision-making. Whether you're a student, working professional, or someone transitioning into analytics, this course gives you the perfect foundation. Choose us for practical training, real-time projects, personalized guidance, industry-ready concepts, and Excel-based analytics skills that top companies are looking for today.
Diverse Career Opportunities in Data Analytics Using Excel: Exploring High-Demand Roles in India’s Corporate Sector
In India, proficiency in Data Analytics using Excel opens doors to a variety of career opportunities across sectors such as IT, finance, consulting, healthcare, retail, and e-commerce. Leading companies like Deloitte, Accenture, IBM, Microsoft, and Amazon actively hire professionals skilled in Excel-based analytics to organize, analyze, and visualize data, automate reporting, and support business decision-making. Excel Data Analytics specialists are highly valued for their ability to handle large datasets, create advanced formulas, generate meaningful insights, build dashboards, and optimize business workflows. Their work enables organizations to make data-driven decisions efficiently and accurately. Salary packages vary depending on skill level and experience. In India, the average annual salary for a Data Analyst skilled in Excel ranges from 500,000 to 850,000 INR, while in the USA it is approximately $75,000 per year, reflecting strong global demand and excellent earning potential in this field.
Get Data Analytics Using Excel Certification
Three easy steps will unlock your Data Analytics Using Excel Certification
- Complete the online/offline Data Analytics Using Excel Course along with all required assignments.
- Work on and successfully complete multiple industry-based Excel analytics projects, including data cleaning, automation, formulas, and visualization.
- Pass the Data Analytics Using Excel Certification Exam to earn your verified, industry-recognized certificate.
The certificate for this Data Analytics Using Excel course will be delivered through our learning management system (LMS). You can download it anytime and add the certificate link to your CV, resume, or LinkedIn profile to showcase your Excel-based data analytics skills.